Let's chat about how you can see the top clicked and purchased products for a keyword using Amazon Brand Analytics.
Amazon Brand Analytics (ABA) helps sellers identify which products get the most clicks and conversions for specific keywords. Understanding this data is what can help you to spot weak competitors, optimize your listings, and focus on high-converting keywords to improve your sales and ad efficiency.
--
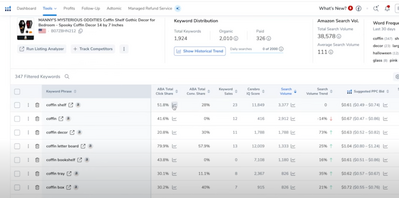
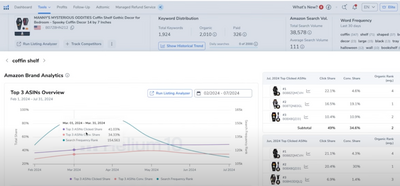
In Cerebro, you can access ABA data for any keyword, showing the top three clicked products, their total click share, and conversion share. Keywords with a few dominant listings may be harder to compete for, while others with a more even click distribution present better opportunities. Poorly converting listings indicate a chance to optimize your product and capture sales.
To analyze this data, look at the ABA Total Click Share and ABA Conversion Share columns in Cerebro.
If a product has high click share but low conversion share, it means shoppers are clicking but not buying, signaling potential for a stronger listing. You can also filter results by these metrics and view historical trends using the graph icon to track performance over time.
Sooo...how can this make you money?
Well - leveraging ABA insights helps you optimize listings, improve PPC targeting, and increase conversions. If your product has a higher conversion rate than click share, it’s a sign of strong purchase intent, allowing you to scale ads profitably. If a competitor gets a lot of clicks but few purchases, you can outperform them by enhancing your offer and listing.
Since ABA provides direct Amazon data, it’s a valuable tool to refine your strategy, dominate underutilized keywords, and maximize profitability. Use it wisely to stay ahead of the competition.
Watch the associated video here: https://youtu.be/ONw4JLvJ40k?si=Ufxa-B3LhF_0a6qZ


